To understand the role of miRNAs in the molecular mechanisms of temporal lobe epilepsy (TLE), researchers at Tianjin Medical University General Hospital investigated the changes in microRNA (miRNA) expression profiles of chronic TLE rat models. LC Sciences’ miRNA microarray analysis results showed that 125 miRNAs were detected in the hippocampus of lithium-pilocarpine-induced TLE rats and normal rats. Compared with normal rats (control group), 23 of the 125 miRNAs were expressed differentially in TLE rats including 5 down-regulated miRNAs (let-7e included) and 18 up-regulated miRNAs (miR-23a/b included). Furthermore, let-7e and miR-23a/b analysis in rat hippocampus were performed by real-time quantitative polymerase chain reaction at 0 h, 1 h, 6 h, 12 h, 24 h, 2 days, 7 days,10 days, 30 days,50 days after induction of status epilepticus (SE). let-7e was detected down-regulated expression at 0 h, 1 h, 6 h, 2 days, 7 days, 50 days after SE and up-regulated expression at 12 h, 24 h, 10 days, 30 days after SE, which was significantly up-regulated expression at 24 h after SE (10.49 folds, P < 0.01). miR-23a/b was detected down-regulated at 0 h, 1 h, 6 h, 12 h, 2 days, 7 days, 10 days, 30 days after SE and significantly up-regulated at 24 h (4.49 folds P < 0.01), 50d (2.4 folds, P < 0.01) after SE. TLE alters the expression levels of a subset of miRNAs in the hippocampus and these deregulated miRNAs may be involved in the pathogenesis of epilepsy directly or indirectly. Also the temporal change of the let-7e and miR-23a/b expression in the epileptogenesis indicated their underlying functions on TLE.
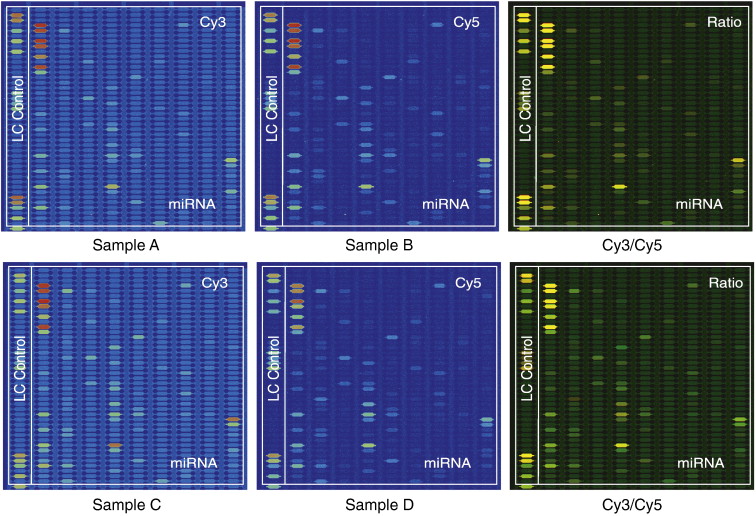
Representative regions of miRNA microarray images. Sample A depicts normal rat and Samples B, C, D represent TLE rats (2 months post-SE). From Cy3 and Cy5 images we can directly read miRNA profiles and from the ratio images we may get a quick sense of differential expressions between the corresponding samples. In the Cy3/Cy5 ratio image, when Cy3 level is higher than Cy5 level the color is green; when Cy3 level is equal to Cy5 level the color is yellow; and when Cy5 level is higher than Cy3 level the color is red.
Related Service
miRNA Microarray Service – LC Sciences provides a microRNA (miRNA) expression profiling service using microarrays based on our in-house developed µParaflo® technology platform. We have standard arrays for all mature miRNAs of all species available in the latest version of the miRBase database (Release 21, July 2014). Our service is comprehensive and includes sample labeling, array hybridization, image data processing and in-depth data analysis. Two-three weeks after receiving your total RNA samples, we’ll send you both the raw and fully analyzed data. [Learn more…]
Reference
Song Y, Tian X, Zhang S, Zhang Y, Li X, Li D, Cheng Y, Zhang J, Kang C, Zhao W. (2011) Temporal lobe epilepsy induces differential expression of hippocampal miRNAs including let-7e and miR-23a/b. Brain Research 1387, 134-140. [abstract]