Taking advantage of LC Sciences’ miRNA microarray service, researchers at the Whitehead Institute for Biomedical Research profiled the expression of >370 miRNAs during adipogenesis of preadipocyte 3T3-L1 cells and adipocytes from leptin deficient ob/ob and diet-induced obese mice. Changes in key miRNAs were validated by RT-PCR. They further assessed the contribution of the chronic inflammatory environment in obese adipose tissue to the dysregulated miRNA expression by tumor necrosis factor (TNF)-alpha treatment of adipocytes. They functionally characterized two adipocyte-enriched miRNAs, miR-103 and miR-143, by a gain-of-function approach.
Similar miRNAs were differentially regulated during in vitro and in vivo adipogenesis. Importantly, miRNAs that were induced during adipogenesis were downregulated in adipocytes from both types of obese mice and vice versa. These changes are likely associated with the chronic inflammatory environment, since they were mimicked by TNF-alpha treatment of differentiated adipocytes. Ectopic expression of miR-103 or miR-143 in preadipocytes accelerated adipogenesis, as measured both by the upregulation of many adipogenesis markers and by an increase in triglyceride accumulation at an early stage of adipogenesis.
These results provide the first experimental evidence for miR-103 function in adipose biology. The remarkable inverse regulatory pattern for many miRNAs during adipogenesis and obesity has important implications for understanding adipose tissue dysfunction in obese mice and humans and the link between chronic inflammation and obesity with insulin resistance.
miRNA expression profiling during 3T3-L1 adipogenesis.
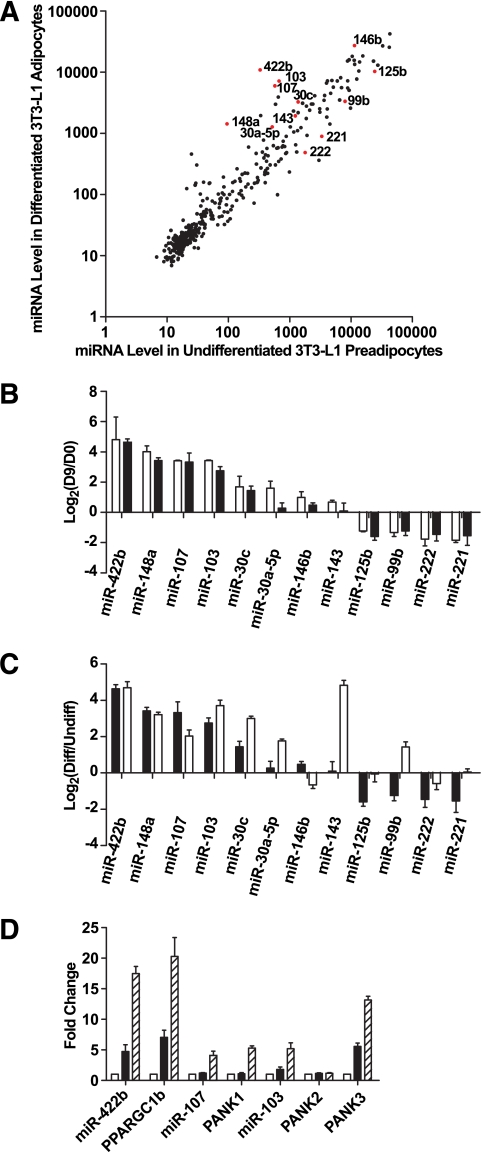
A: Intensity scatter plot showing comparison of miRNA profiles between undifferentiated 3T3-L1 preadipocytes (day 0) and differentiated 3T3-L1 adipocytes (day 9). The 12 miRNAs that are the focus of our detailed analyses are highlighted in red and indicated by a label. B: Validation of miRNA array results for 12 regulated miRNAs by RT-PCR assays. Expressions for all miRNAs are plotted as fold-change in log2 scale; positive indicates enriched in day 9 vs. day 0. □, Array result (n = 2); ■, RT-PCR result (n = 4). Data are expressed as means ± SE. C: Comparison by RT-PCR of miRNA regulation during 3T3-L1 differentiation and primary fat cell development. Expressions of all miRNAs are normalized to internal control and plotted as fold-change in log2 scale. ■, day 9 vs. day 0, same data as Fig. 1B (n = 4); □, mature adipocytes vs. enriched preadipocytes (n = 4). Data are expressed as mean ± SE. D: Intronic miRNAs and their host genes are co-regulated during adipogenesis. miR-422b is in the intron of PPARGC1b; miR-107 is in the intron of PANK1; the two copies of miR-103 are in the introns of PANK2 and PANK3. miRNA expression levels are measured by RT-PCR and normalized to internal control. Expression levels of mRNAs are also determined by RT-PCR and normalized to internal control. Expressions are shown as fold-change relative to the level at day 0. □, day 0; ■, day 2; ▨, day 4. Data are expressed as mean ± SE (n = 3).
Related Service
miRNA Microarray Service – LC Sciences provides a microRNA (miRNA) expression profiling service using microarrays based on our in-house developed µParaflo® technology platform. We have standard arrays for all mature miRNAs of all species available in the latest version of the miRBase database (Release 21, July 2014). Our service is comprehensive and includes sample labeling, array hybridization, image data processing and in-depth data analysis. Two-three weeks after receiving your total RNA samples, we’ll send you both the raw and fully analyzed data. [Learn more…]
Reference
Lodish HF, Xie H. (2009) MicroRNAs Induced During Adipogenesis that Accelerate Fat Cell Development Are Downregulated in Obesity. Diabetes 58(5), 1050-57. [article]